匹配滤波(Matched-filter)提取信号
这篇文章是学习使用匹配滤波方法(matched-filter method)从记录中提取信号时记录的系列笔记的第三篇,主要整理在引力波(gravitational wave)探测领域中使用匹配滤波方法从信噪比较低的记录中提取信号的基本知识。
本文主要参考的资料为:
- Allen, B. (2005). $\chi ^2$ time-frequency discriminator for gravitational wave detection. Physical Review D, 71(6), 062001. DOI: https://doi.org/10.1103/PhysRevD.71.062001.
- Sathyaprakash, B. S., & Schutz, B. F. (2009). Physics, astrophysics and cosmology with gravitational waves. Living Reviews in Relativity, 12(1), 2. DOI: https://doi.org/10.12942/lrr-2009-2.
- Tutorial: Find an Inspiral.
探测器的噪音
一般来说,引力波探测器的输出$s(t)$可以看作是信号$h(t)$和噪音$n(t)$的简单叠加,即 \[ \begin{equation} s(t) = h(t) + n(t) \end{equation} \] $s(t)$通常为应力(strain)结果,噪音$n(t)$的来源主要由仪器本身和周围环境,也具有应力的量纲,$h(t)$为引力波在仪器中产生的真实信号。
在具体分析前,我们首先定义Fourier变化关系,对于时间序列$x(t)$, \[ \begin{equation} \tilde{x}(f) = \int_{-\infty}^{\infty} x(t) \exp(-i2\pi ft) dt \end{equation} \] \[ \begin{equation} x(t) = \int_{-\infty}^{\infty} \tilde{x}(f) \exp(i 2\pi ft) df \end{equation} \]
对于噪音$n(t)$,我们往往认为其是均值为零的稳态的高斯噪音(stationary Gaussian noise),性质由其统计学特征所确定。对于随机信号来说,功率谱密度往往可以代表其在频率域的特征,在这里 \[ \begin{equation} \left < \tilde{n}(f) \tilde{n}^{* }(f’) \right > = \frac{1}{2} S_n(f) \delta(f-f’) \end{equation} \] 其中$<\cdot>$表示系综平均(ensemble average),$S_n(f)$为噪音的单边功率谱密度(one-sided power spectral density),满足 \[ \begin{equation} \left < n^2(t) \right > = \int_{0}^{\infty} S_n(f) df \end{equation} \] 由于噪音$n(t)$序列为实数序列,即$\tilde{n}(-f) = \tilde{n}^{* }(f)$,所以在这里我们可以采用只在正频率定义的单边功率谱密度$S_n(f)$来表示噪音在频率域的特征。
匹配滤波(Match filter)
匹配滤波(matched filter)方法是在稳态高斯随机噪音中提取已知信号的常见方法(e.g. Abbott et al., 2016; Allen et al., 2012; )。匹配滤波是一个最佳线性滤波器,也就是在输入已知信号和稳态高斯随机噪声的情况下,获得最大信噪比(signal to noise ratio, SNR)。
根据匹配滤波理论,对于已知信号模板(template)$h(t)$及其频谱$\tilde{h}(f)$,实现最大信噪比的滤波器可以表示为$\tilde{h}^{* }(f)/S_n(f)$,由于$h(t)$为实序列,$\tilde{h}^{* }(f)$对应的时间域表示$h(-t)$,即为模板时间反向的结果(time-reversed template),因此最优滤波器也就是一个通过噪音频谱加权之后的反向模板(a time-reversed copy of the template, weighted by the expected noise in the detector)(Allen, 2005)。
探测器的输出$s(t)$在经过滤波器之后的结果为
\[ \begin{equation} \begin{split}
z(t_0) & = \int_{-\infty}^{\infty} \frac{\tilde{h}^{* }(f) \tilde{s}(f)}{\frac{1}{2}S_n(|f|)} e^{i2\pi f t_0} df \\
& = 4 \mathfrak{R} \left\lbrace
\int_{0}^{\infty} \frac{\tilde{h}^{* }(f) \tilde{s}(f)}{S_n(f)} e^{i2\pi f t_0} df
\right\rbrace
\end{split}\end{equation} \]
从上式中我们也可以看出,匹配滤波过程计算的其实就是探测器输出$s(t)$和经噪音的功率谱密度加权之后的模板信号$h(t)$之间的互相关函数。
这里,我们引入两个函数$\tilde{A}(f)$和$\tilde{B}(f)$的内积(inner product),记为 \[ \begin{equation} \left( \tilde{A}(f),\tilde{B}(f) \right ) = 4 \mathfrak{R} \left\lbrace \int_{0}^{\infty} \frac{\tilde{A}^{* }(f) \tilde{B}(f)}{S_n(f)} df \right\rbrace \end{equation} \] 这样 \[ \begin{equation} z(t_0) = \Bigl( \tilde{h}(f)e^{-i2\pi f t_0}, \tilde{s}(f) \Bigr) \end{equation} \]
由于探测器的输出为信号$h(t)$(如果存在的话)和噪音$n(t)$的简单叠加,因此$z$的期望为 \[ \begin{equation} \left \langle z \right \rangle = 4 \mathfrak{R} \left\lbrace \int_{0}^{\infty} \frac{\tilde{h}^{* }(f) \tilde{h}(f)}{S_n(f)} e^{i2\pi f t_0} df \right\rbrace = \Bigl( \tilde{h}(f)e^{-i2\pi f t_0}, \tilde{h}(f) \Bigr) \end{equation} \] 利用公式(4),我们同样可以得到$z^2$的期望 \[ \begin{equation} \left \langle z^2 \right \rangle = \Bigl( \tilde{h}(f)e^{-i2\pi f t_0}, \tilde{h}(f) \Bigr)^2 + \Bigl( \tilde{h}(f), \tilde{h}(f) \Bigr) \end{equation} \] 这样我们就可以计算$z$对应的不确定度(uncertainty),定义$\delta z = z - \left \langle z \right \rangle$,$z$的方均根(root mean square)可以表示为 \[ \begin{equation} \sqrt{\langle(\delta z)^2 \rangle} = \sqrt{\langle(z -\langle z \rangle)^2 \rangle } = \sqrt{\langle z^2 \rangle - \langle z \rangle ^2} = \Bigl( \tilde{h}(f), \tilde{h}(f) \Bigr)^{1/2} \end{equation} \]
更进一步,我们定义信噪比(SNR)$\rho$为滤波器的输出$z$和其方均根$\sqrt{\langle(\delta z)^2 \rangle}$的比值 \[ \begin{equation} \rho = \frac{z}{\sqrt{\langle (\delta z)^2 \rangle}} \end{equation} \] 这样当探测器输出只有噪音时,根据公式(9)-(12),$\langle \rho \rangle = 0$,$\langle \rho ^2 \rangle = 1$
需要说明的是,公式(6)计算得到的是互相关的时间序列,其中$t_0$表示探测器输出和模板之间的时间差,而当我们知道$t_0$时,或信号模板和探测器输出没有时间差时,我们可以直接计算 \[ \begin{equation} z = 4 \mathfrak{R} \left\lbrace \int_{0}^{\infty} \frac{\tilde{h}^{* }(f) \tilde{s}(f)}{S_n(f)} df \right\rbrace \end{equation} \]
一个例子
这里我们通过 Gravitational Wave Open Science Center (https://www.gw-openscience.org/about/)中的教程Find an Inspiral: Optimal matched filter来展示在实际信号检测中,匹配滤波是如何应用的。其中所需要的探测器记录数据、模板数据和相应的Python脚本都可以在教程主页Tutorial: Find an Inspiral下载。
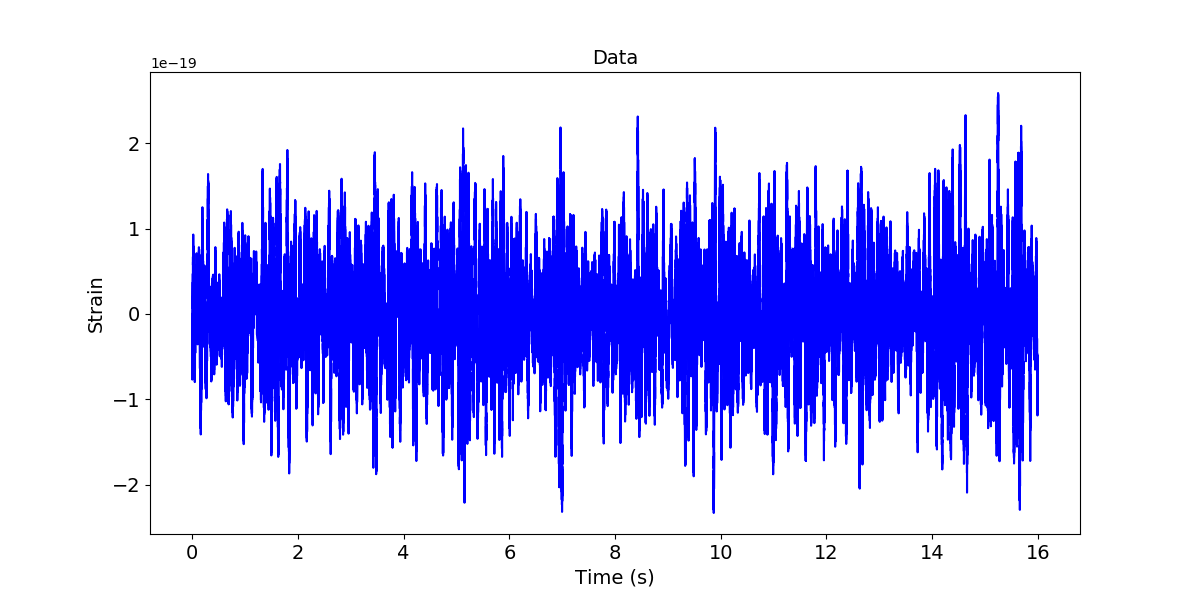
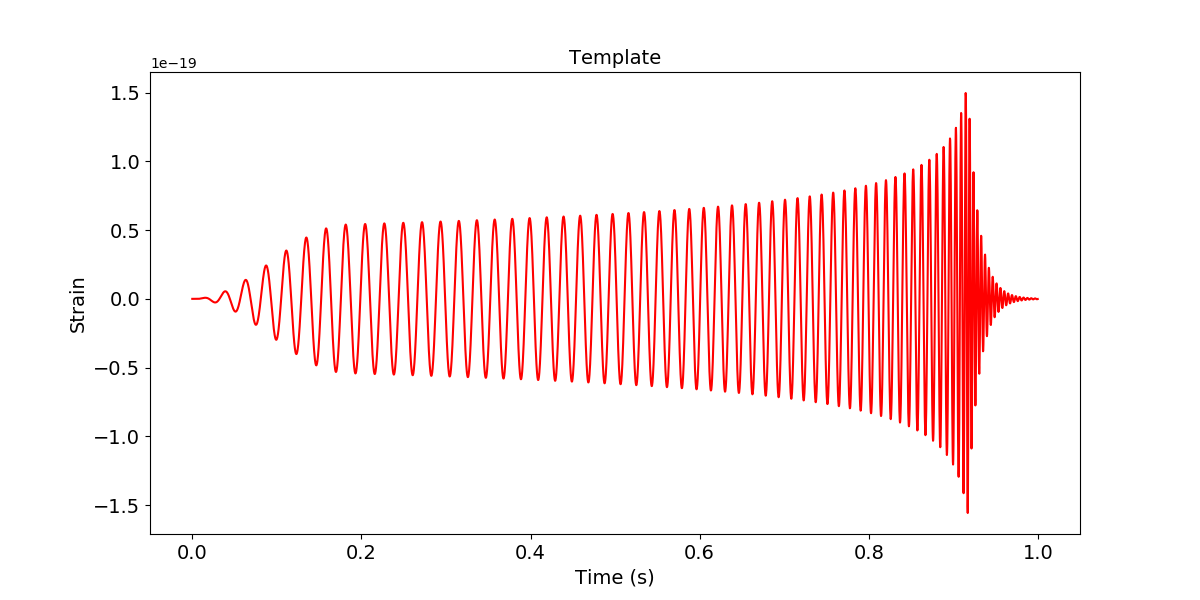
首先读入数据,这里的数据和模板的采样率均为$4096 \mathrm{Hz}$,数据长度$16 \mathrm{s}$,模板信号长度$1 \mathrm{s}$。
import numpy as np
import matplotlib.pyplot as plt
import scipy.signal as sig
import h5py

#-------------------------------------
#-- Read in data and template
#-------------------------------------
fs = 4096
dataFile = h5py.File('data_w_signal.hdf5', 'r')
data = dataFile['strain/Strain'][...]
dataFile.close()
time = np.arange(0, 16, 1./fs)

templateFile = h5py.File('template.hdf5', 'r')
template = templateFile['strain/Strain'][...]
temp_time = np.arange(0, template.size / (1.0*fs), 1./fs)
templateFile.close()

#------------------------
# Plot data and template
#------------------------
plt.figure(figsize=(12,6))
plt.plot(time,data, color='b')
plt.xlabel('Time (s)',fontsize=14)
plt.xticks(fontsize=14)
plt.ylabel('Strain',fontsize=14)
plt.yticks(fontsize=14)
plt.title('Data',fontsize=14)

plt.figure(figsize=(12,6))
plt.plot(temp_time, template, color='r')
plt.xlabel('Time (s)',fontsize=14)
plt.xticks(fontsize=14)
plt.ylabel('Strain',fontsize=14)
plt.yticks(fontsize=14)
plt.title('Template',fontsize=14)


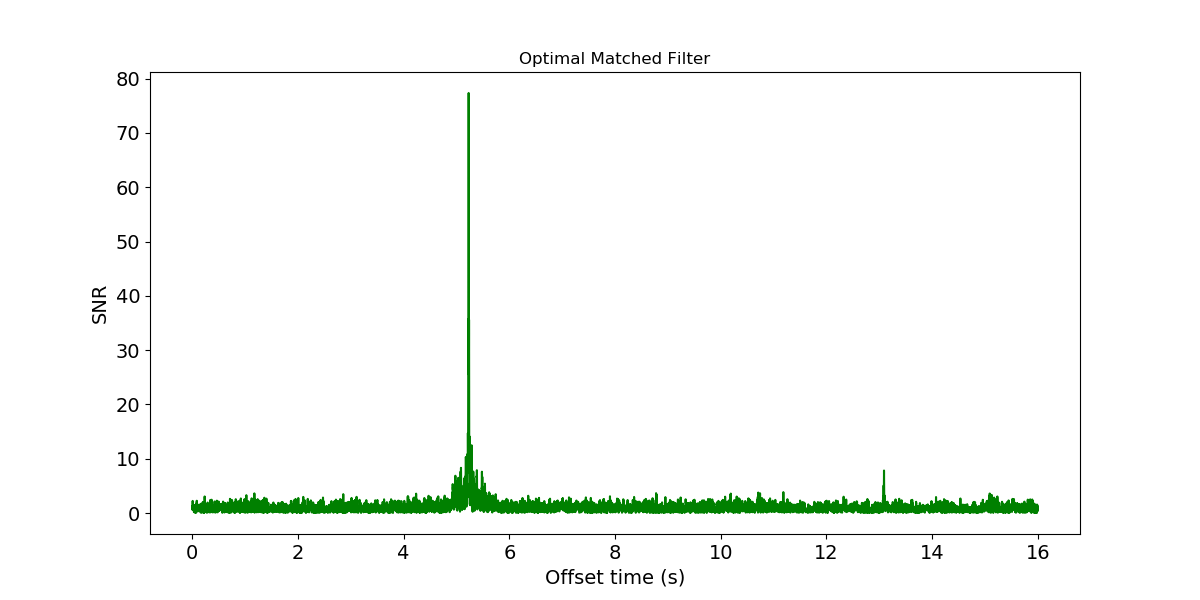
进行匹配滤波,具体步骤分别为:
- 计算探测器记录$s(t)$的Fourier变换$\tilde{s}(f)$;
- 对模板$h(t)$补零,使其与探测器记录长度相等,并计算补零后的模板的Fourier变换$\tilde{h}(f)$;
- 计算噪音(即没有信号时探测器的输出,这里已知信号出现在前$12 \mathrm{s}$)的PSD$S_n(f)$;
- 对探测器数据进行匹配滤波,即$z(t_0) = 2 \int_{-\infty}^{\infty} \frac{\tilde{h}^{* }(f) \tilde{s}(f)}{S_n(\lvert f \rvert)} e^{i2\pi f t_0} df$;
- 计算$z$的方均根$\sqrt{\langle(\delta z)^2 \rangle}= \left\lbrace 2 \int_{-\infty}^{\infty} \frac{\tilde{h}^{* }(f) \tilde{h}(f)}{S_n(\lvert f \rvert)} df \right \rbrace ^{1/2}$,并得到最终的信噪比$\rho(t_0) = \frac{\lvert z(t_0) \rvert}{\sqrt{\langle(\delta z)^2 \rangle}}$
#------------------------------
# Optimal Filter, freq. domain
#------------------------------
#-- Take the FFT of the data
data_fft=np.fft.fft(data)

#--- Pad template and take FFT
zero_pad = np.zeros(data.size - template.size)
template_padded = np.append(template, zero_pad)
template_fft = np.fft.fft(template_padded)

# --- Match FFT frequency bins to PSD frequency bins
power_data, freq_psd = plt.psd(data[12*fs:], Fs=fs, NFFT=fs, visible=False)
datafreq = np.fft.fftfreq(data.size)*fs
power_vec = np.interp(datafreq, freq_psd, power_data)

# --- Apply the optimal matched filter
optimal = data_fft * template_fft.conjugate() / power_vec
optimal_time = 2*np.fft.ifft(optimal)

# -- Normalize the matched filter output
df = np.abs(datafreq[1] - datafreq[0])
sigmasq = 2*(template_fft * template_fft.conjugate() / power_vec).sum() * df
sigma = np.sqrt(np.abs(sigmasq))
SNR = abs(optimal_time) / (sigma)

# -- Plot the result
plt.figure(figsize=(12,6))
plt.plot(time, SNR, color='g')
plt.title('Optimal Matched Filter')
plt.xlabel('Offset time (s)',fontsize=14)
plt.xticks(fontsize=14)
plt.ylabel('SNR',fontsize=14)
plt.yticks(fontsize=14)
plt.show()

这只是一个简单的例子,LIGO Open Science Center (LOSC)网站中还有一个更为详细的例子BINARY BLACK HOLE SIGNALS IN LIGO OPEN DATA,给出了更为丰富的数据处理过程和方法。
其他参考文献
- Abbott, B. P., Abbott, R., Abbott, T. D., Abernathy, M. R., Acernese, F., Ackley, K., et al. (2016). GW150914: First results from the search for binary black hole coalescence with Advanced LIGO. Physical Review D, 93(12), 122003. DOI: https://doi.org/10.1103/PhysRevD.93.122003.
- Allen, B., Anderson, W. G., Brady, P. R., Brown, D. A., & Creighton, J. D. (2012). FINDCHIRP: An algorithm for detection of gravitational waves from inspiraling compact binaries. Physical Review D, 85(12), 122006. DOI: https://doi.org/10.1103/PhysRevD.85.122006.
- Moore, C. J., Cole, R. H., & Berry, C. P. (2014). Gravitational-wave sensitivity curves. Classical and Quantum Gravity, 32(1), 015014. https://iopscience.iop.org/article/10.1088/0264-9381/32/1/015014/meta