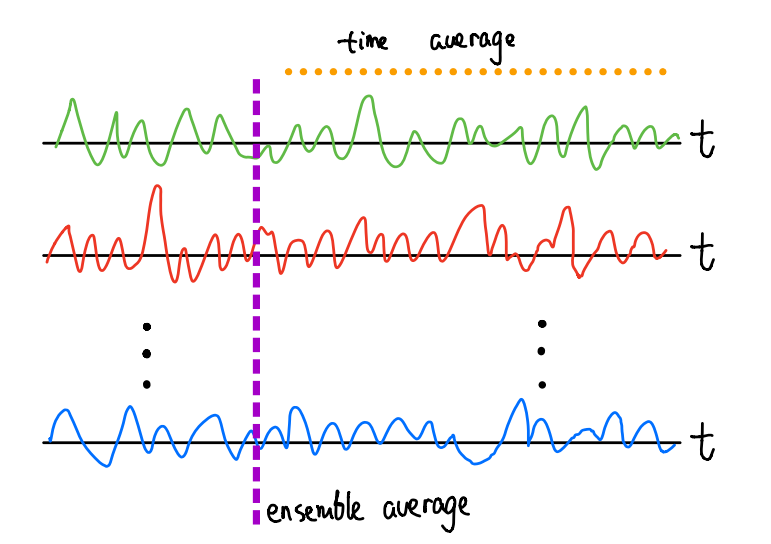
随机信号(Random Signals)笔记
这篇文章是学习使用匹配滤波方法(matched-filter method)从记录中提取信号时记录的系列笔记的第一篇,主要整理关于随机过程(random processes)和随机信号(random signals)的基本知识。
本文主要参考的资料为:
- 牛津大学Prof. David Murray的课程资料: https://www.robots.ox.ac.uk/~dwm/Courses/2TF_2011/2TF-N6.pdf
- Barry Van Veen的系列课程: https://allsignalprocessing.com/course-introduction-information/
一般来说,根据信号是否可以表达为时间的函数,可以将信号分为 确定性信号(deterministic signals) 和非确定性信号(non-deterministic signals)或 随机信号(random signals)。对于前者,信号可以通过时间的函数、映射等来确定,即对于给定的时间 t,我们可以确定给出信号 f(t)。而对于后者,信号是由一些随机过程来确定的,虽然信号的一些统计量,例如均值(mean)或方差(variance)可以是已知的,但是我们无法确定给出 t 时刻的信号值。在实际数据处理中,我们往往将噪音(noise)视作随机信号。
复习一下概率知识
在概率中的一个重要概念就是 概率密度函数(probability density function, pdf),其表示了随机变量的输出在某个取值点附近的可能性,即 \[ \begin{equation} \mathrm{Prob} \left\lbrace x_1<x<x_2 \right\rbrace = \int_{x1}^{x2}p(x) dx \end{equation} \]
一些常见的概率密度函数
- 均匀分布(uniform distribution)
\[
\begin{equation}
p(x) =
\begin{cases}
1/(b-a), & a<x<b \\
0, & \mathrm{otherwise} \end{cases} \end{equation} \] - 高斯正态分布(Gaussian distribution) \[ \begin{equation} p(x) = \frac{1}{\sqrt{2\pi\sigma^2}} \exp \left\lbrace-\frac{(x-m)^2}{2\sigma^2}\right\rbrace \end{equation} \] 其中$m$和$\sigma^2$分别表示均值(mean)和方差(variance)。
- 其他常见分布:$\chi^2$分布, Poission分布等。
如何描述一个概率密度函数
常用的统计量:
- 均值(mean): On average, what value is observed? \[ \begin{equation} m = E[x] = \int_{-\infty}^{\infty}x p(x) dx \end{equation} \]
- 方差(variance): On average, what is the squared distance from the mean? \[ \begin{equation} \sigma^2 = E[(x-m)^2]=\int_{-\infty}^{\infty}(x-m)^2 p(x) dx \end{equation} \] 注意这里的表达式都是针对连续的随机变量(continuous random variable)。
其中\(E[\cdot]\)表示期望(expectation),即无限多次试验的平均值。
随机过程(random process)
- 对于随机变量$x$, 其可以看作是自身就是随机的,又或者可以看作是一个随机实验(random experiment)的输出$\theta$的确定性映射$x\equiv x(\theta)$;
- 随机过程可以看作是随机信号(random)在时间域的采样,是时间的函数$x(t)$;
- 需要注意的是,当我们说$x(t_1)$时,并不是指一个确定的随机变量的值,而是在大量重复试验(a set repeated trials)中在$t_1$时刻得到的值的集 (ensemble) ;
- 我们可以定义系综平均 (ensemble average) 为 \[ \begin{equation} E[x(t_1)] = \int_x x(t_1)p(x) dx = \int_{\theta} x(t_1,\theta)p(\theta) d\theta. \end{equation} \]
The ensemble autocorrelation
Ensemble autocorrelation 的定义为在时刻$t_1$和$t_2$对随机过程进行采样并计算自相关,即 \[ \begin{equation} R_{xx}^E(t_1,t_2) = E[x(t_1)x(t_2)] \end{equation} \]
平稳性(Stationarity)
如果一个随机过程满足
- 期望$E[x(t)]$ 与时间无关 the expectation value $E[x(t)]$ is independent of time;
- 而且系综自相关只由时间差$t_2-t_1$确定 the ensemble value for autocorrelation depends only on the difference between $t_2$ and $t_1$, that is $\tau=t_2-t_1$
那么我们就说这个随机过程是宽平稳的 (wide sense stationary)。
对于平稳过程,ensemble autocorrelation只与时间间隔$\tau=t_2-t_1$有关 \[ \begin{equation} R_{xx}^E(\tau) = E[x(t)x(t+\tau)] = \int_{-\infty}^{\infty} x(t,\theta)x(t+\tau,\theta)p(\theta) d\theta \end{equation} \]
- Ensemble autocorrelation 具有功率(power)的量纲;
- 稳态随机过程产生的是频率信号(stationary random processes give rise to power signals);
- 稳态随机信号不一定有Fourier transforms。
平稳信号(stationary signals)的例子
这里以离散信号$ \left\lbrace x[n], -\infty <n<\infty \right\rbrace $为例,对于平稳信号
均值 $\mu[n] = E[x[n]] = \mu$
自相关 $R^E[n,n-k] = E[x[n]x[n-k]] = R^E[k]$
(1) Random binary signal
\[x[n]= \begin{cases} 0, & P=0.5 \\ 1, & P=0.5 \end{cases}\]均值\(\mu=0.5\)
自相关\(R^E[k] = \begin{cases} 0.5, & k=0 \\ 0.25, & k\ne 0 \end{cases}\)
(2) White Gaussian noise
\[w[n] \sim N(0,\sigma^2)\]均值\(\mu=0\)
自相关\(R^E[k] = \begin{cases} \sigma^2, & k=0 \\ 0, & k\ne 0 \end{cases}\)
(3) Random sinusoid
\[y[n] = A \cos(\omega_0 n +\phi), \quad A\sim N(0,\sigma_A^2), \quad \phi \sim U(0,2\pi)\]均值\(\mu=0\)
自相关\(R^E[k] = \frac{\sigma_A^2}{2}\cos (\omega_0 k)\)
遍历性(Ergodicity)
对于一个稳态随机过程(stationary random process),我们可以从两个角度来定义其自相关函数
- ensemble autocorrelation \[\begin{equation} R_{xx}^E(\tau) = E[x(t)x(t+\tau)] \end{equation}\]
- temporal autocorrelation \[\begin{equation} R_{xx}^E(\tau) = \lim \limits_{T \to \infty} \frac{1}{T} \int_{-T/2}^{2/T} x(t)x(t+\tau)dt \end{equation}\] 如果上面两个自相关是相同的,我们就说这个过程是遍历的(ergodic)。
An ergodic process is a stationary random process whose ensemble autocorrelation is identical with its temporal autocorrelation.
ensemble averages is equal to time averages.

功率谱密度(Power spectral density)
在这篇笔记里,直接给出随机信号的功率谱密度(关于功率谱密度的更详细的介绍,以及功率谱的计算见笔记功率密度谱(Power Spectral Density)笔记)。
稳态随机过程的功率谱密度$S(f)$的定义为 \[ \begin{equation} S_{xx}(f) = \mathscr{F}[R_{xx}] \end{equation} \] 这里只考虑遍历性的信号,所以使用$R_{xx}$表示任一一种自相关函数。
如何描述一个随机过程
- 均值(mean) \[ \begin{equation} \mu_x = E[x] = \int_\theta x(t,\theta)p(\theta) d\theta \end{equation} \]
- 方差(variance) \[ \begin{equation} \sigma^2 = E[(x-\mu_x)^2] = E[x^2] -2\mu_xE[x] + \mu_x^2 = E[x^2] - \mu_x^2 \end{equation} \]
- 自相关(autocorrelation) \[\begin{equation} R_{xx}(\tau) = E[x(t,\theta)x(t+\tau,\theta)] \end{equation}\]
- 功率谱密度(power spectral density, PSD) \[ \begin{equation} S_{xx}(f) = \mathscr{F}[R_{xx}] = \int_{-\infty}^{\infty} R_{xx}(\tau)\mathrm{e}^{-i2\pi f \tau} d\tau \end{equation} \]
系统对于随机信号的响应
这一部分关注的是,一个稳态随机信号$x(t)$经过一个脉冲响应为$h(t)$的确定线性系统并得到输出$y(t)$时,其特征(characteristics)或描述(descriptors)是如何变化的。
在时间域我们有 \[ \begin{equation} y(t) = x(t) * h(t) = \int_{-\infty}^{\infty} x(\tau) h(t-\tau) d\tau \end{equation} \]
-
输出的 均值 为 \[ \begin{equation} \mu_y = E[y] = H(0)E[x] \end{equation}\] 其中$H(f)=\mathscr{F}[h(t)]$。
-
输出的 功率谱密度 为 \[ \begin{equation} S_{yy}(f) = |H(f)|^2 S_{xx}(f) \end{equation} \]
-
输出的 自相关 为 \[ \begin{equation} R_{yy}(\tau) = \int_{-\infty}^{\infty} S_{yy}(f) \mathrm{e}^{i2\pi f \tau} df \end{equation} \] 特别地, \[ \begin{equation} R_{yy}(0) = \int_{-\infty}^{\infty} S_{yy}(f) df = \int_{-\infty}^{\infty} |H(f)|^2 S_{xx}(f) df \end{equation} \]
-
输出的 方差 为 \[ \begin{equation} \sigma_y^2 = E[y^2]-\mu_y^2 = R_{yy}(0) - \mu_y^2 \end{equation} \]
白噪音(White noise)和高斯白噪音(Gaussian white noise)
白噪音 是一个在所有频率上具有均匀功率谱密度的宽稳态随机过程$x(t)$: \[ \begin{equation} S_{xx}(f) = A \end{equation} \] 其自相关函数因此是一个 $\delta$-函数 \[ \begin{equation} R_{xx}(\tau) = \mathscr{F}^{-1}[A] = A\delta(\tau) \end{equation} \] 白噪音的几个特征:
- 通过对PSD的积分可以发现其功率无穷大;
- 无穷大的功率意味着$x(t)$在某一时刻可以是$+\infty$,而下一时刻为任意值,甚至$-\infty$;
- 自相关函数是$\delta$-函数说明某一时刻的值与下一时刻不相关;
- $x(t)$的均值为$\mu_x = E[x] = 0$;
- 方差$\sigma_x^2 = E[x^2]-\mu_x^2 = E[x^2]$也是无穷大。
高斯白噪音
考虑一个均值为$0$,方差为$\sigma_x^2$的高斯分布$p_x(\theta)$,我们从中用类似白噪音的方式,即前后时刻不相关的方式来取样得到$x(t,\theta)$即为高斯白噪音。
高斯白噪音的自相关函数为 \[ \begin{equation} R_{xx}(\tau) = E[x(t)x(t+\tau)] = \sigma_x^2 \delta(\tau) \end{equation} \] 值得注意的是,即使方差是有限的,高斯白噪音过程依然是物理上不可实现的,因为其功率谱密度为 \[ \begin{equation} S_{xx}(f) = \sigma_x^2 \end{equation} \] 这样积分得到的功率依然是无穷大的。通过分析可以看出,不论对于任何分布,只要采样是 不相关 的,得到的自相关函数$R_{xx}$就是$\delta$-函数,而频率域的的功率谱密度$S_{xx}(f)$依旧在所有频率为同一个值,也就意味着信号拥有无穷功率。